Regardless of whether you are working with soluble or membrane proteins, numerous crystallization conditions need to be screened and optimized to find the appropriate conditions for crystallization. One of the main factors for successful crystallization in Lipidic Cubic Phase (LCP) is the ability of the protein to diffuse within the lipid bilayer. The diffusion rate of the protein is affected by protein aggregation, structural properties of the LCP, and the chemical environment. The diffusion rate can be determined by Fluorescence Recovery After Photobleaching (FRAP), which measures the amount of time required for the fluorescence intensity of a tagged protein to reestablish itself within a small area in the LCP drop that has been subject to optical bleaching (Figure 1). The curve of normalized fluorescence intensity vs. time can be plotted and analyzed to quantify two diffusion-related characteristics: mobile fraction (the value that the intensity curve asymptotically approaches) and the diffusion rate (proportional to the slope at the starting point of the curve).
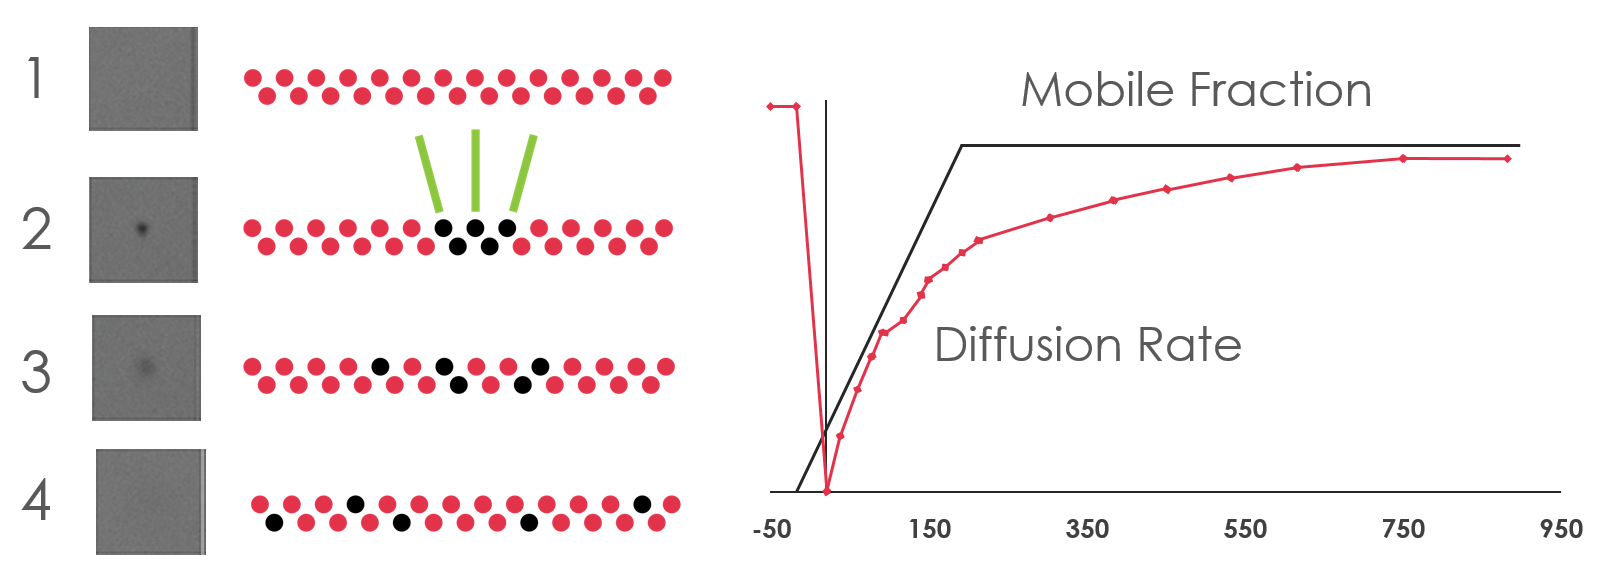
Figure 1. 1) A Pre-bleached sample image is taken as the baseline fluorescence intensity; 2) The sample is photobleached by a small (~15 micron diameter) laser spot. 3) The intensity within this bleached spot is monitored as the bleached molecules diffuse out and fresh molecules diffuse in.
The recent introduction of an automated LCP-FRAP instrument, first developed at Scripps Institute and now produced by FORMULATRIX® , has greatly accelerated the overall process of screening LCP plates.4 Instead of waiting for days to weeks to determine if crystals have formed, FRAP provides immediate insight as to whether the conditions are optimal for crystallization and enables the rejection of those conditions that will not result in crystallization due to poor diffusion. While the entire FRAP process is still relatively slow, requiring 15-20 minutes per drop to complete, relatively small amounts of protein are needed. One way of circumventing the long data-acquisition time for each LCP-FRAP sample is to collect only the end-state fluorescence intensities.
By using this three-point data collection method (Figure 2), the FRAP system from FORMULATRIX can bleach all 96 wells sequentially and then return to collect the fluorescence recovery image. Although only the mobile-fraction result can be recovered from this method, researchers will still be able to identify the potentially positive samples by relying solely on mobile fraction analysis.
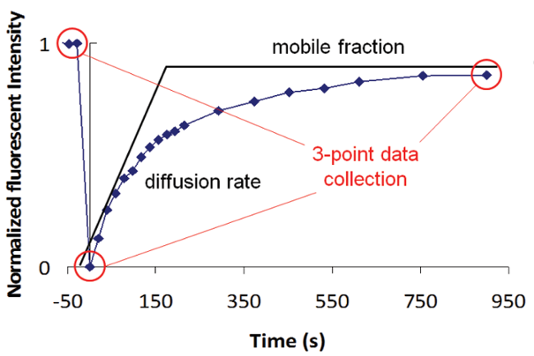
Figure 2. A high throughput FRAP method is used to only collect the end state fluorescence intensity to determine the mobile fraction results.
Utilizing the work-flow shown in Figure 3, the RockImager-FRAP from FORMULATRIX can achieve 96-well FRAP data collection in under 50 minutes.
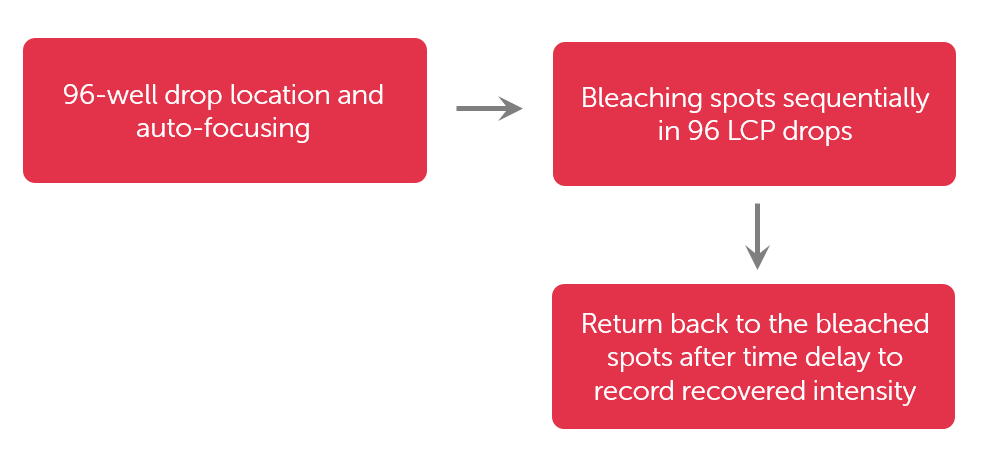
Figure 3. High Throughput LCP-FRAP data collection flow chart
The FRAP mobile-fraction data for an entire plate can be grouped into a canvas view with a color-coded background to allow the user to identify positive wells quickly (Figure 4). Researchers can then interact with the software to mark wells as positive or negative hits. In most cases, mobile recovery data alone is sufficient for researchers to identify potentially positive conditions. Nonetheless, one might still want to generate the complete recovery curve to examine the curve shape and determine the diffusion rate. To avoid running all 96 samples through complete recovery, this process is applied only to those potentially positive wells designated by the user during the three-point, high-throughput FRAP analysis.
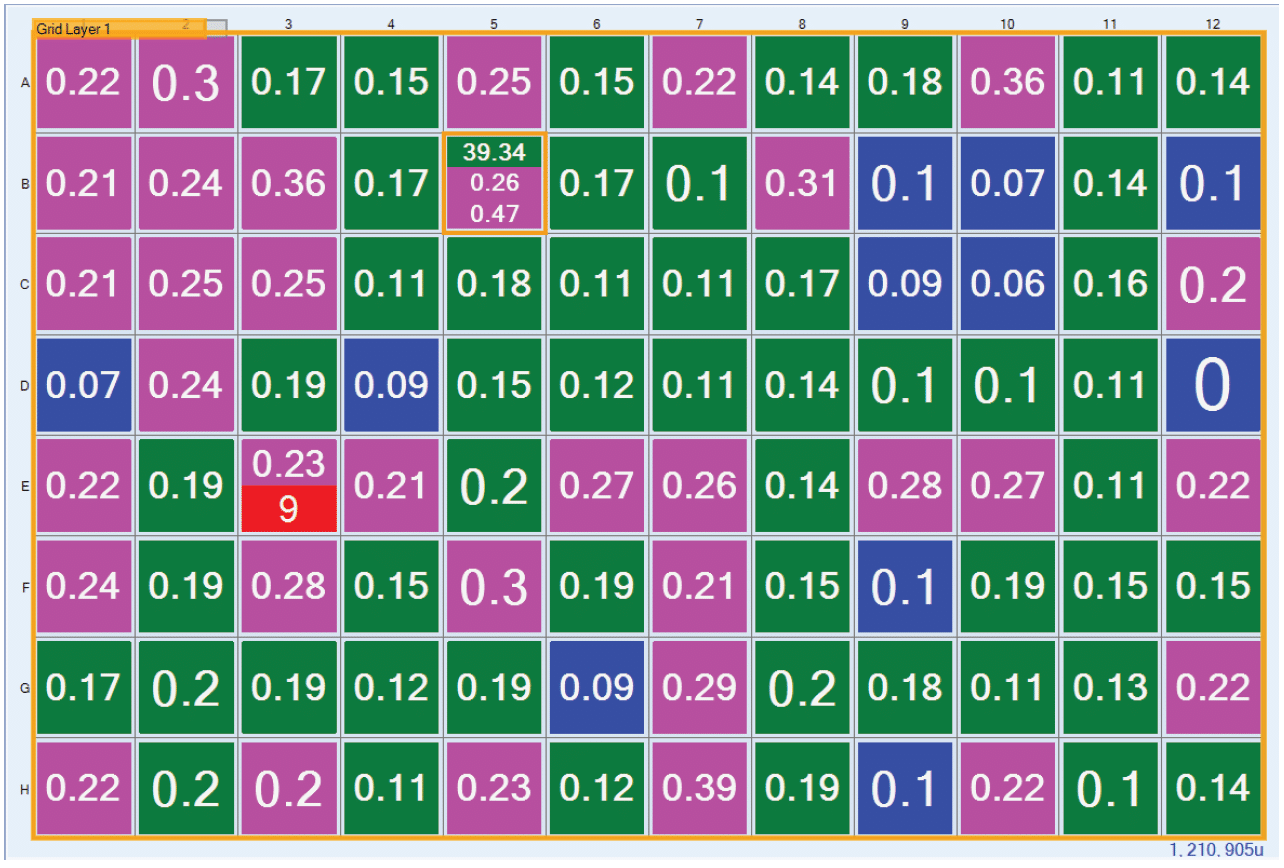
Figure 4. FRAP mobile fraction data collected displayed in a canvas view color-coded for positive and negative fast identification.
The complete intensity recovery curve can be plotted and fitted with Bessel functions to extract the diffusion rate and the recovery time. In most cases, a single Bessel function is sufficient to achieve low residual error fitting results. In the majority of remaining instances, two different types of molecules are simultaneously diffusing. This is often the result of the protein not being sufficiently well purified, with both lipid and protein molecules labeled by fluorescent dye. The smaller molecular-weight lipid diffuses much faster than the large protein molecule. In such circumstances, a two-component Bessel function fitting is necessary to accurately model the two distinct diffusion rates.