Protein crystallization imaging
The unambiguous and reliable identification of biological crystals remains a major obstacle in crystallography, particularly in the critical stage of initial screening experiments. Automated imaging at high-resolution in the visible range is often insufficient to identify all conditions that have or may result in crystals.
Crystallographers have often relied on the intrinsic fluorescence of aromatic amino acids, such as tryptophan, to differentiate between salt and protein crystals. UV fluorescence imaging detects the fluorescence from the tryptophan and in many cases yields high contrast images that aid in the characterization of crystallization drops. In some cases, proteins have very few tryptophan amino acids, or none at all, making it impossible to use UV fluorescence for imaging. The addition of a fluorescent molecule to one’s protein enables the ability to do visible fluorescence imaging and acquire high contrast images in very short imaging times with no sample damage.
dye labeling of proteins
There are many methods for labeling proteins with a fluorescent dye and range from very simple protocols with no purification steps to more involved methods that utilize columns to remove excess dye.1,2,3 One simple protocol involves the dissolution of a succinimidyl ester dye in DMSO and then the addition of it directly to one’s protein solution, waiting 5 minutes and then dispensing protein as normal.4 The FORMULATRIX® imagers are extremely sensitive in detecting fluorescence, making it necessary to only label 0.1% of total proteins. Example calculation is shown at end of note. When adding dye to the protein, it is important to utilize a buffer that does not contain competing reactive amines and has a pH of 7 to 8. It has been observed that after waiting 5 minutes, more than 80% of the dye has been labeled to the protein when working at labeling rates of less than 1% of all lysines, making it unnecessary to remove excess dye from solution. Labeling at rates greater than 1% will yield incomplete hydrolysis of the reactive ester and result in excess unbound dye in solution creating a strong fluorescent background when imaging. 0.1% to 0.3% labeling is sufficient in generating high contrast images with the FORMULATRIX imagers. Increasing rates of labeling will only decrease image quality and/or require purification to remove excess dye. pH strongly affects the labeling efficiency with very low or high pH leading to complete failure to label. pH around 6.5 may result in selective labeling of the amino terminus of the protein. Optimal pH is between 7.0 and 8.4 which will yield expected results.
In general, the idea of modifying a protein with a small molecule is disconcerting and fear of it negatively impacting crystallization and conformation is of concern to some. The protocols and examples described here are for 0.1% of the available lysines to be labeled resulting in a negligible effect on the rest of the 99.9% proteins. That being said, it is not a completely controlled process, and one could imagine that a labeled protein conformation could be affected depending on where the dyes attached. Noting that this is a relatively random process of which lysines are bound to dye, the conformations will vary but will still be statistically irrelevant in comparison to the 99.9% unlabeled proteins. Crystallography is an averaging technique that results in a final structure which is an average of every single molecule in the crystal. Therefore, anomalies of 0.1% of the proteins will be averaged out and not affect the overall final crystalline structure.
Also, diffraction-quality crystals are comprised of very homogeneous protein molecules. This means that if the label affected the protein structure/conformation, the labeled protein would not end up in the crystal in the first place. The opposite is also true, if labeled protein ended up being in a diffracting crystal, than its conformation would be near-identical to the unlabeled protein and not adversely affect the crystalline structure. This is what is expected and what the technique relies on.
Multi-Fluorescence Imaging
The FORMULATRIX imager offers the ability to automatically image crystallization plates with three different wavelengths. This allows scientists to utilize both intrinsic fluorescence using the UV channel as well as two other visible wavelengths. The optics are designed for both UV and visible fluorescence imaging with separate light sources for each channel to increase sensitivity. The filter cubes are automatically switched when imaging plates and are fully customizable to work with dyes of interest (Figure 1).
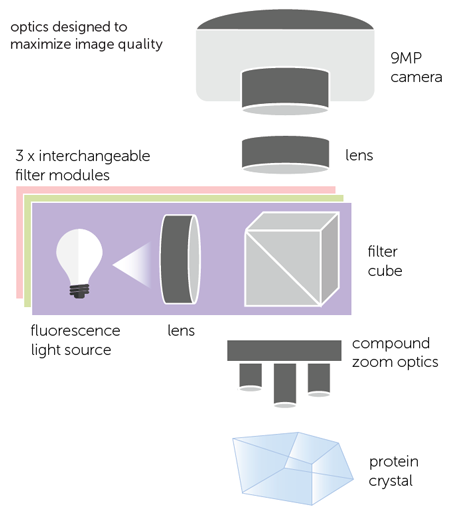
Figure 1. Multi-Fluorescence optical light path with automatic switching of 3 fully customizable filter modules.
Protein-protein complex detection is simplified with multi-fluorescent imaging. One can simply label each protein with a different fluorophore, image with both visible fluorescent channels and wherever fluorescence overlap is found, one knows that both proteins are present in the crystal (Figure 2).

Figure 2. ProteinA-ProteinB complex crystals with protein A labeled with texas red and protein B labeled with fluorescein.
Fluorescent dye options and impacts
Dye choices can be made based on the proteins in use, the pH range and cost. It is also important to make sure that if using two different dyes there is minimal spectral overlap. Generally, all N-hydroxysuccinimide ester conjugated dyes will be efficient in labeling given that they are water-soluble. Fluorescein and Texas Red are two inexpensive dyes that are spectrally separate and yield good results. However, they do exhibit a pH dependence with fluorescein being especially sensitive to pH less than 7.0 with a pKa of 6.4 (Figure 3) making it not ideal if screening a wide variety of cocktail conditions. Alexa 488 and Alexa 594 are good options for two spectrally separate dyes that do work well under a variety of conditions and demonstrate no pH dependence between pH 4 and 10.
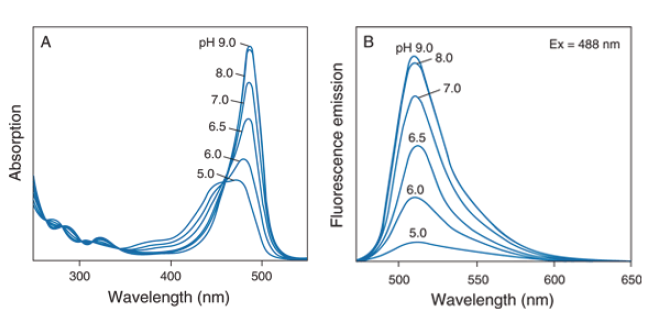
Figure 3. The pH-dependent spectra of fluorescein: A) absorption spectra, B) emission spectra. https://www.thermofisher.com/us/en/home/references/molecularprobes-the-handbook/fluorophores-and-their-a minereactive-derivatives/fluorescein-oregon-green-andrhodamine-green-dyes.html
Labeling of membrane proteins
Labeling of membrane proteins is not as easy as soluble proteins. For membrane proteins, a large number of lysine residues may be non-accessible making it hard to determine the correct amount of dye to add. Also, most fluorescent dyes contain a highly hydrophobic aromatic ring which has been rendered water soluble by linking to charged groups. Therefore, many dyes will partition into hydrophobic detergent micelles or bicelles causing the effective concentration in solution to vary & result in a higher concentration of non-reacted dye. A useful example for labeling membrane proteins is explained by Cherezov in his FRAP assay methods paper.5
screening with visible fluorescence
The increased sensitivity in using fluorescent dyes makes it easier to find crystals when screening. For example, small crystals buried under precipitate can be distinguished due to the higher concentration of protein in the small crystal compared to the surrounding precipitate (Figure 4). Small crystals can also be seen with high resolution using high magnification objectives. The large range of zoom values available allow the drop to automatically be located and then imaged with a higher magnification. Custom defined regions of interest can also be interrogated with higher resolution to yield finer detail and contrast (Figure 5).
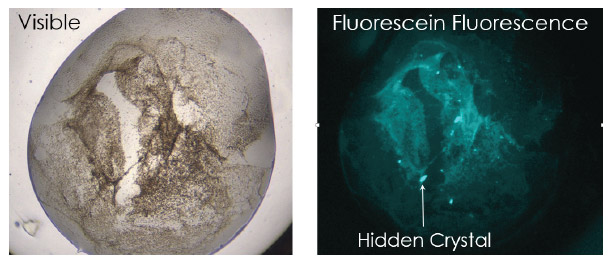
Figure 4. Small protein crystals are visualized in a visible fluorescence image that otherwise can not be seen in traditional brightfield image.
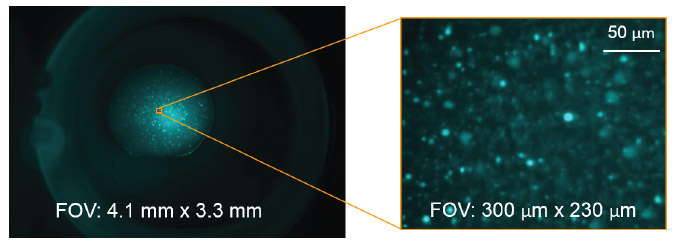
Figure 5. A large range of fields of view in the FORMULATRIX imagers allow for drops to be automatically imaged and custom regions of interest to be defined to yield higher resolution images.
Conclusion
An arsenal of imaging techniques are available to screen protein crystallization plates including visible, birefringence, UV fluorescence and visible fluorescence imaging. The ability to tag a very small percentage of proteins with small molecule fluorophores allows one to detect areas of high protein concentrations. The fluorescence from the dye labeled proteins allows one to easily differentiate between protein and salt crystals, as well as find small crystals hidden under precipitate. It is also an excellent tool when working with protein protein complexes. One can simply label each protein with a different dye and then image to see where they find co-localization of fluorescence. This makes it possible to determine if crystals contain both proteins without needing to do XRD for characterization. Labeling rates of 0.1% have negligible to no impact on the crystalline quality and protein structure output making it a non-invasive methodology.
0.1% labeling example - lysozyme
1. Dissolve dye in DMSO to create 5mM stock solution
2. Using MW constant of lysozyme as 14.7kDa (147000 g/mole), one can convert 20 mg/ml lysozyme solution to 1.36 mM
3. Assuming a 1:1 stoichiometric labeling efficiency to amine residues & using fact that lysozyme has 6 lysines, 100% labeling of all active sites is equal to 8.16 mM
4. If desired to only label 0.1% of sites, then dye addition should be at concentration of 8.16 μM
5. Addition of 0.4 μL of 5mM dye to 250 μL of 20mg/ml lysozyme solution yields 0.1% labeling of protein
References
1. Pusey M, et al. Acta Cryst. (2015) F71, 806-814
2. Watts, D., et al. Acta Cryst. (2010) D66, 901-908
3. Groves, M.R., et al. Acta Cryst. (2006) D63, 526-535
4. Labeling protocol adapted by Moritz Hunkeler, Maier Lab at Biozentrum Basel
5. Cherezov, V., et al. Cryst Growth Des. (2008) B(12), 4307-4315